Sales Pipeline & Weighted Forecast Tracker
Log your deals by stage and get a live weighted forecast, open pipeline by stage, coverage against quota, and a flag for deals stuck too long — no CRM required. Built for Excel and Google Sheets, free to download.
What's inside
Deals
One row per deal: name, account, owner, stage, amount, stage-entered date, expected close, source. Probability, weighted value, and days-in-stage fill in automatically. Drop-down for stage.
Forecast
Weighted forecast, open pipeline, coverage vs your quota, deals aging over 30 days, and open pipeline by stage — all calculated.
Stages
Editable stage list with win probabilities. Change a probability and every weighted number updates.
Ask your pipeline — with "win rate" meaning one thing
The template gives you a weighted forecast. For "stage-to-stage conversion and forecast by owner," upload the deals to Quiriz and ask in plain English. Define win rate and stage probabilities once in Company Context so the rep, the report, and Slack all return the same figure.
Ask your pipeline a question →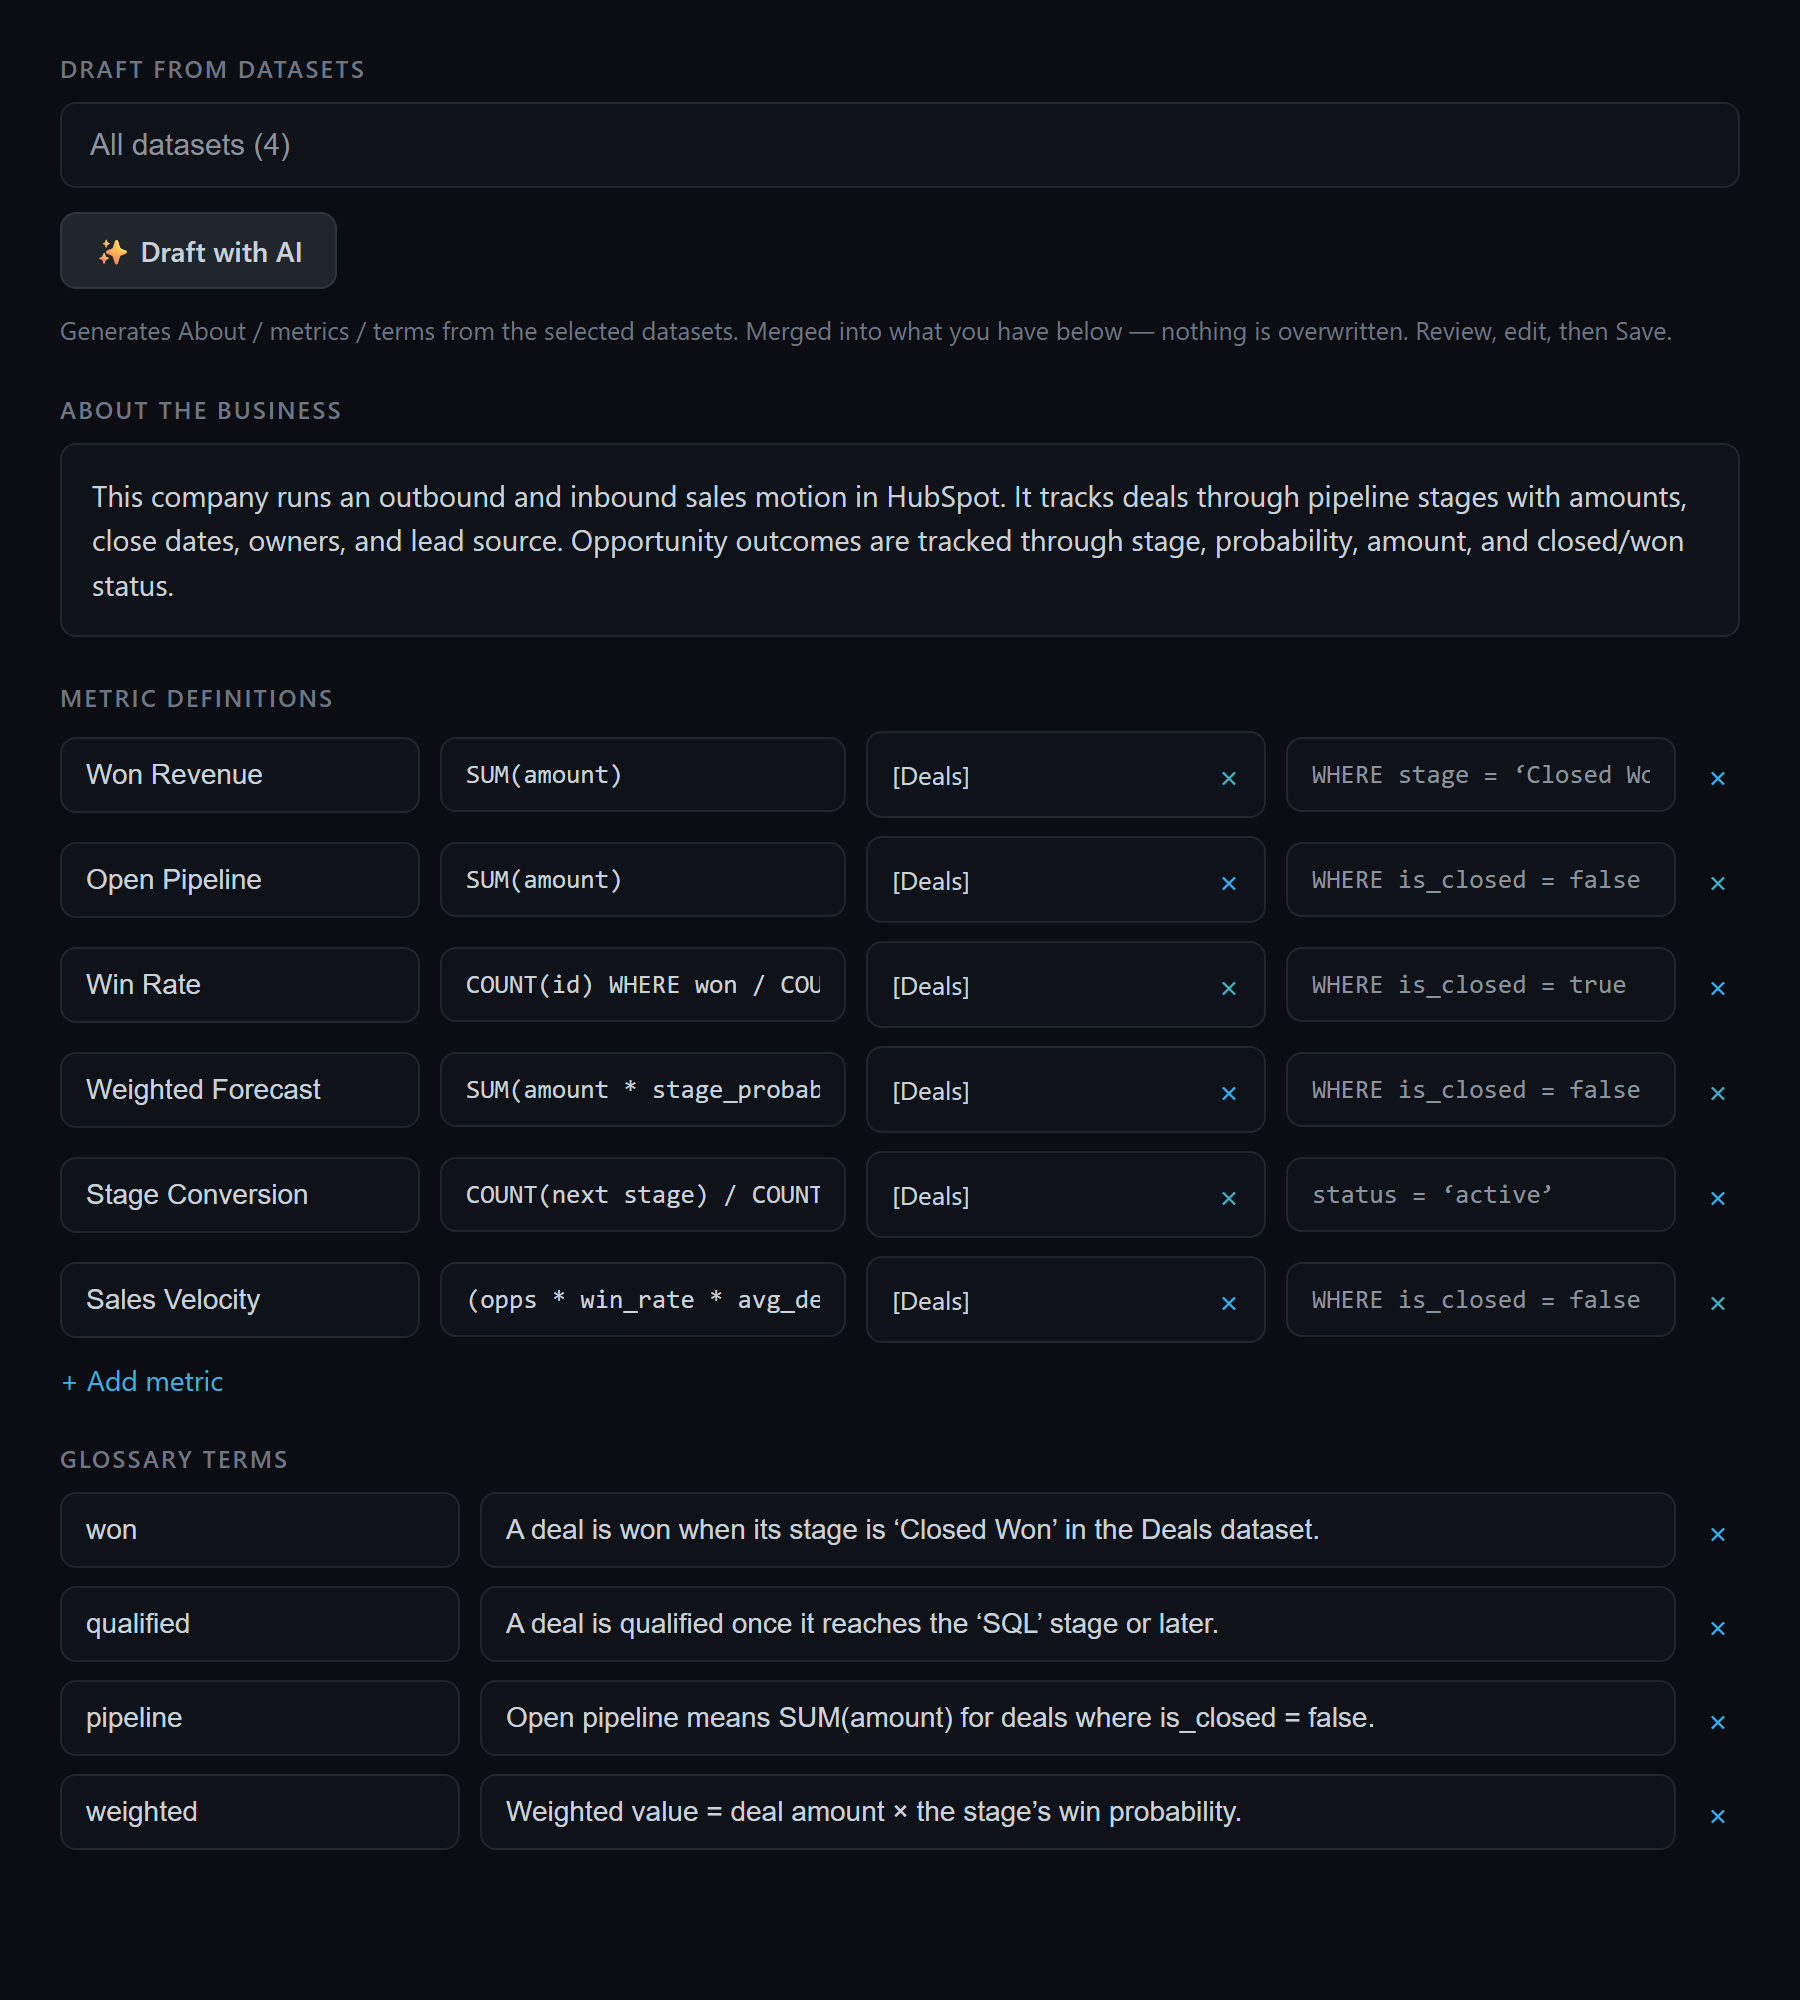
How to use it
- Download and open it in Excel, or import it into Google Sheets (File → Import → Upload).
- Set your stage probabilities on the Stages sheet (defaults included).
- Log each deal on the Deals sheet: pick a stage, enter amount and dates. Probability, weighted value, and days-in-stage calculate themselves.
- Enter your quota on the Forecast sheet to see coverage, and read the weighted forecast and stage breakdown.
Frequently asked questions
How does the weighted forecast work?
What is coverage ratio?
Does this template work in Google Sheets?
Do I need a CRM to use it?
Related: sales pipeline analysis (6 formulas) · analyze a CRM export · consistent numbers from AI.