Sales Pipeline Analysis in a Spreadsheet
Your CRM shows a list of deals, not whether the forecast is defensible. Here are the six formulas that expose where deals stall and what the pipeline is really worth — stage conversion, win rate, aging, velocity, coverage, and a weighted forecast.
A CRM gives you a list of deals. Six formulas turn that list into an answer to "where do deals stall, and is the forecast real?" All of them are SUMIFS / COUNTIFS / SUMPRODUCT — no macros.
1. Stage conversion
Count deals that reached each stage, then divide each by the prior stage. If 120 reached Demo and 40 reached Proposal, Demo→Proposal converts at 33%. The biggest drop is where to focus.
=COUNTIF(Stage, "Proposal") / COUNTIF(Stage, "Demo")2. Win rate
Of closed deals, what share are won: =COUNTIF(Stage,"Closed Won") / COUNTIFS(Stage,"Closed*"). Decide deliberately whether open deals belong in the denominator.
3. Stage aging
Days a deal has sat in its current stage: =TODAY()-[Stage Entered]. Sort descending to find the stalled deals the forecast is quietly leaning on.
4. Sales velocity
Revenue the pipeline produces per day: (open opps × win rate × avg deal) ÷ cycle days. Raising win rate or shrinking the cycle both move it.
5. Coverage ratio
Open pipeline ÷ quota: =SUMIF(Stage,"<>Closed*",Amount) / Quota. If you close 1 in 4, 3x coverage is thin — coverage should scale inversely with win rate.
6. Weighted forecast
Each open deal's amount × its stage probability, summed: =SUMPRODUCT(Amount, Probability). A defensible commit instead of a gut number.
Keeping "win rate" meaning one thing
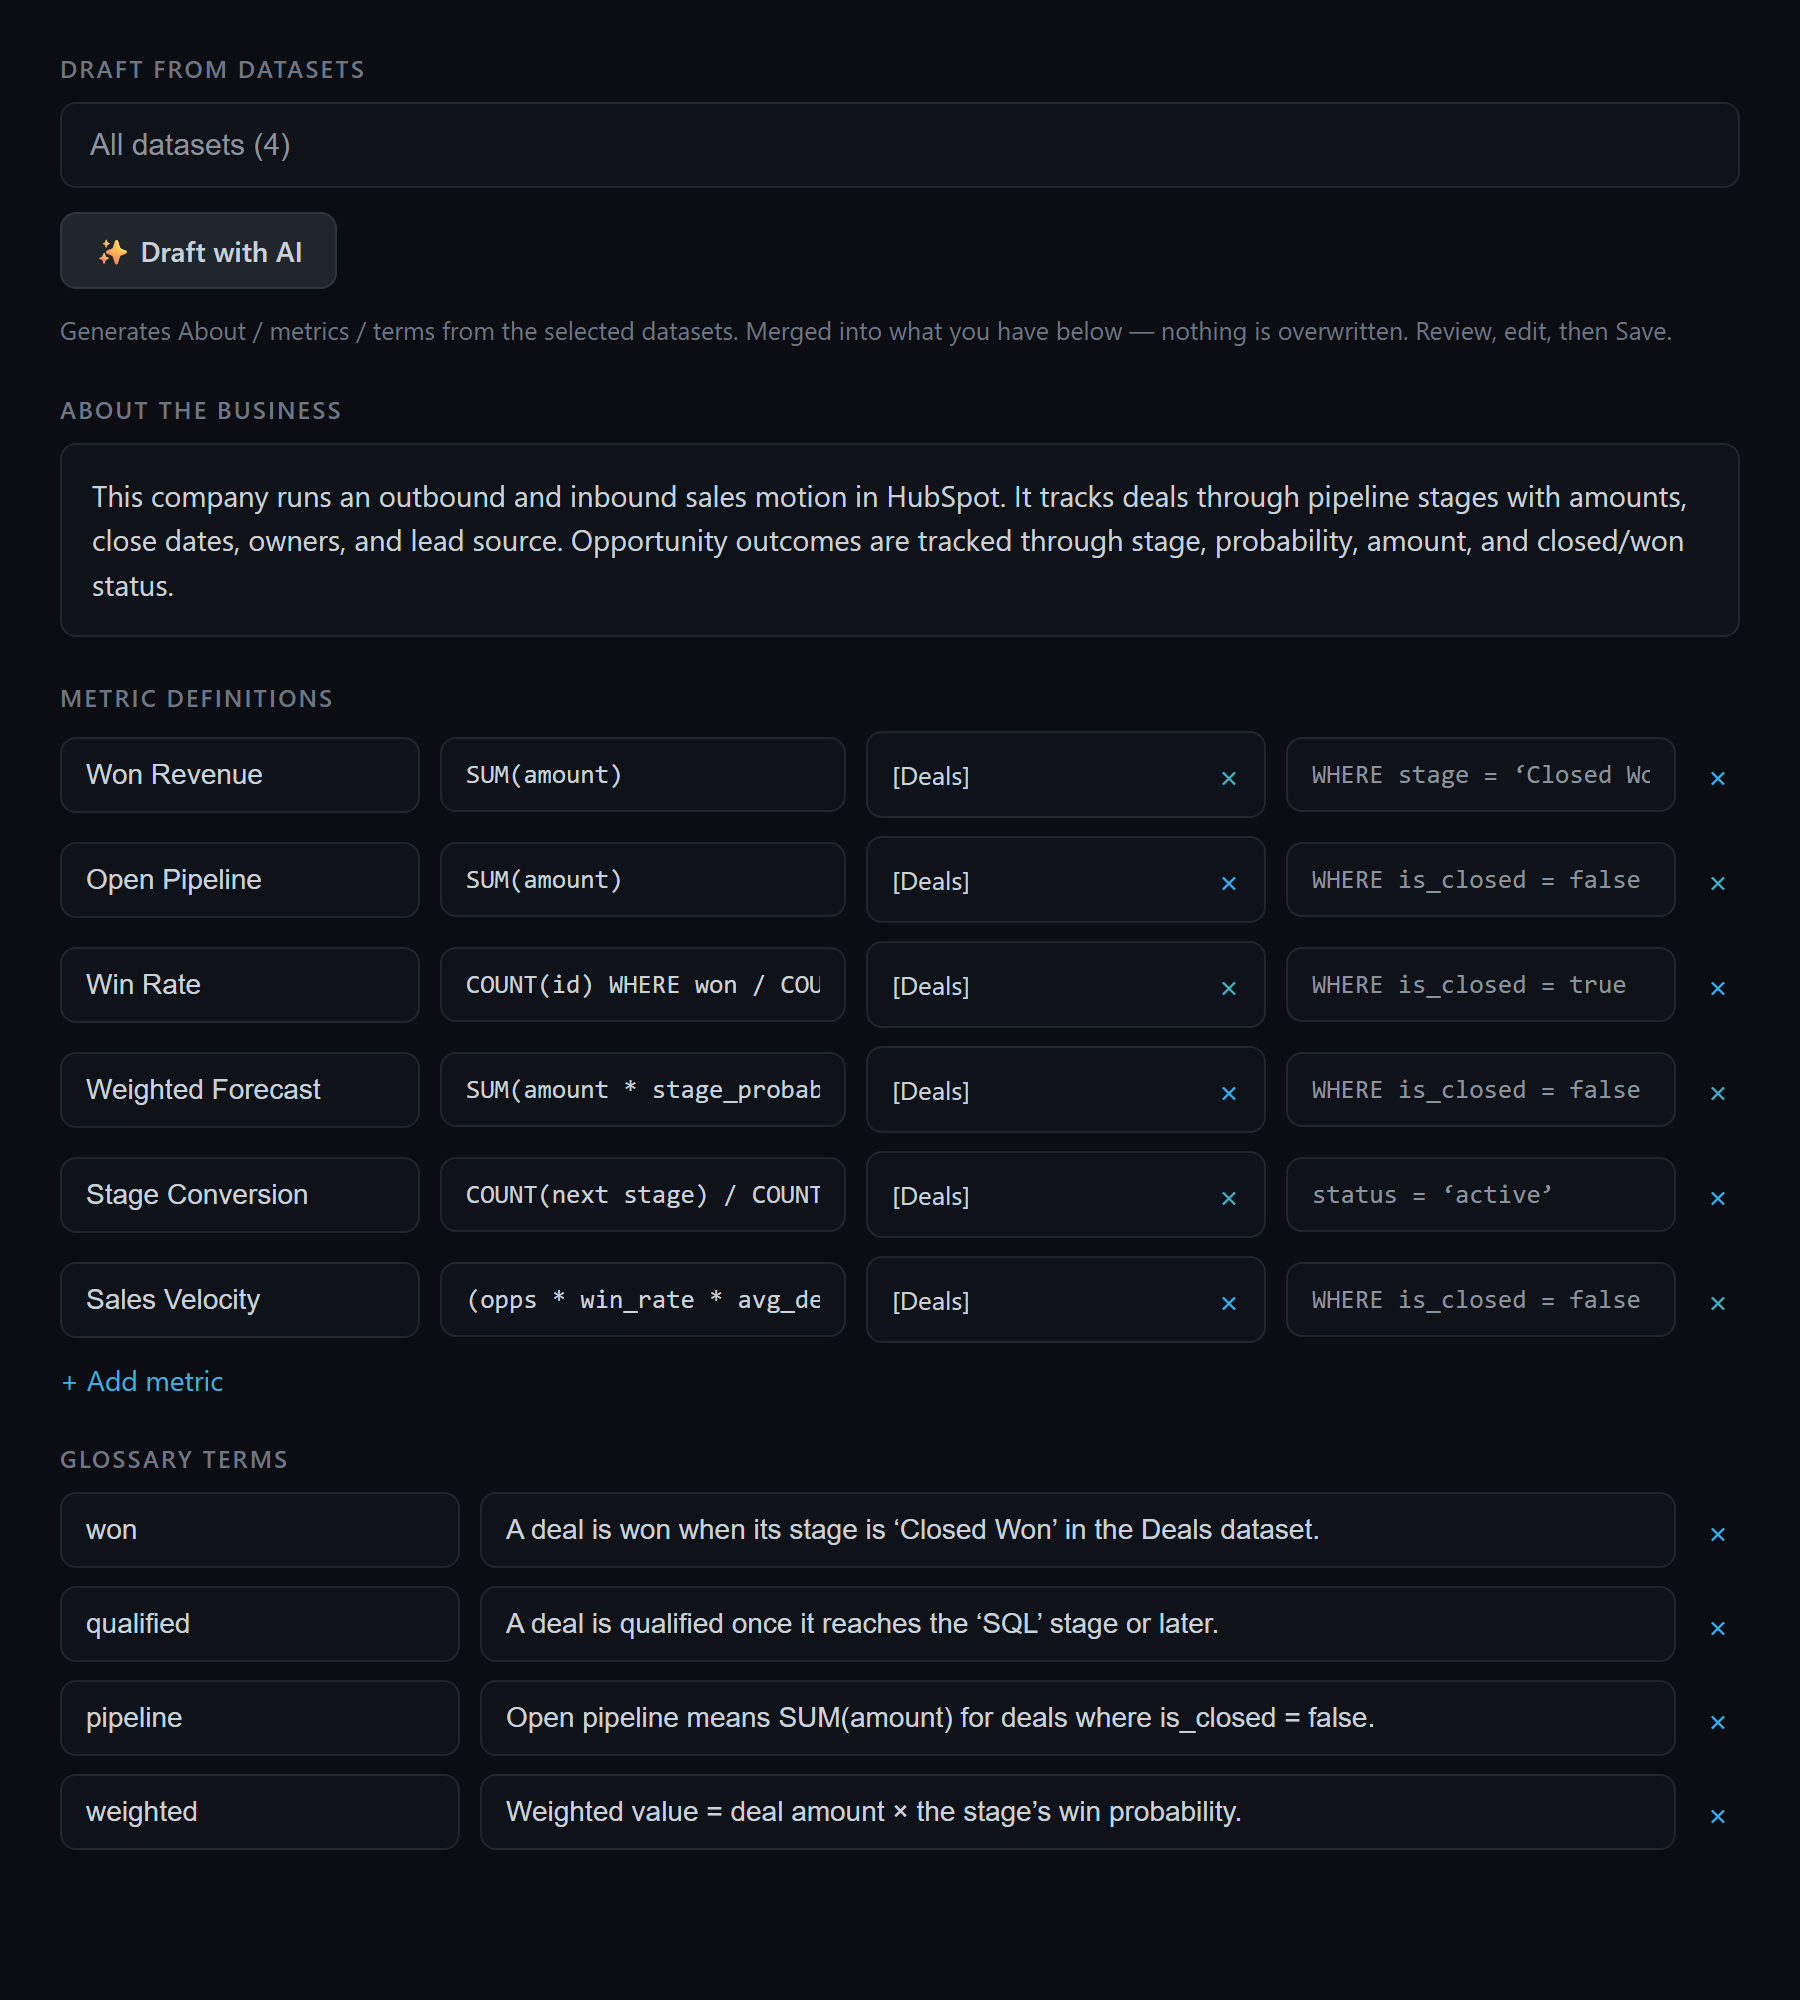
These formulas only agree if everyone agrees what "won", "qualified", and each stage probability mean. Point Quiriz at the deals export and an admin defines Win Rate, Weighted Forecast, and the stage glossary once in Company Context — so the rep, the report, and the Slack question all return the same figure.
Ask your pipeline the hard questions
Upload your deals export and ask Quiriz for conversion, velocity, and a weighted forecast in plain English — consistent definitions, every time. Free to start.
Try Quiriz free →