How to Calculate ROAS by Channel in a Spreadsheet
Platform-reported ROAS double-counts and flatters every channel. Here is how to build true per-channel ROAS from your own numbers, work out the break-even ROAS you actually need, and use blended MER as the honest cross-check.
The quick version: per channel, ROAS = revenue ÷ spend. But the number that matters is ROAS against your break-even (1 ÷ margin), and the honest cross-check is blended MER — total revenue ÷ total spend — because platform-reported ROAS double-counts every conversion.
Build the channel table
One row per channel: channel, ad spend, attributed revenue, orders. If your export is one row per order or per day, roll it up with SUMIFS instead of copying numbers by hand:
=SUMIF(Data!B:B, "Meta", Data!D:D)   'revenue for Meta
=SUMIF(Data!B:B, "Meta", Data!C:C)   'spend for Meta
ROAS per channel
With spend in C and revenue in D: =D2/C2, copied down. That is your reported ROAS. Now make it mean something.
Break-even ROAS (the number that matters)
A 3x ROAS is a win at 60% margin and a loss at 25%. Break-even ROAS is =1/margin. Put your gross margin in a cell and compare every channel to it:
=1/$B$1        'break-even ROAS at margin in B1
=IF(D2/C2 > 1/$B$1, "profitable", "losing")
Blended MER — the honest cross-check
Sum revenue across channels and it will exceed your real sales, because Meta, Google, and TikTok each claim the same buyer. MER = total revenue ÷ total ad spend can't be inflated that way. If your channel ROAS looks great but MER is flat, attribution is lying to you.
Getting the same ROAS every time
The hard part isn't the formula — it's that "revenue" and "ROAS" have to mean the same thing every time someone asks. If you point Quiriz at your orders and ad-spend files, an admin can define ROAS and MER once in Company Context, and every question returns the same figure — no re-deriving it per person.
The same problem has a stricter answer once the definitions are stored rather than retyped. ROAS, CPA, CPC, CPM and CTR are pre-defined for paid media, computed from summed spend and summed conversions across your Google, Meta and LinkedIn exports — never as the average of a daily rate column, which is where the spreadsheet version drifts.
On the store side the same discipline applies to margin: net sales, gross profit and contribution margin are pre-defined for e-commerce and break down by product category — with contribution margin and gross profit also breaking down by acquisition channel, and ad spend that matches no order reported as an explicit Unallocated row rather than spread across the channels to make the table look tidy. The join itself is the step that stalls; there is a walkthrough in joining Shopify and ad exports.
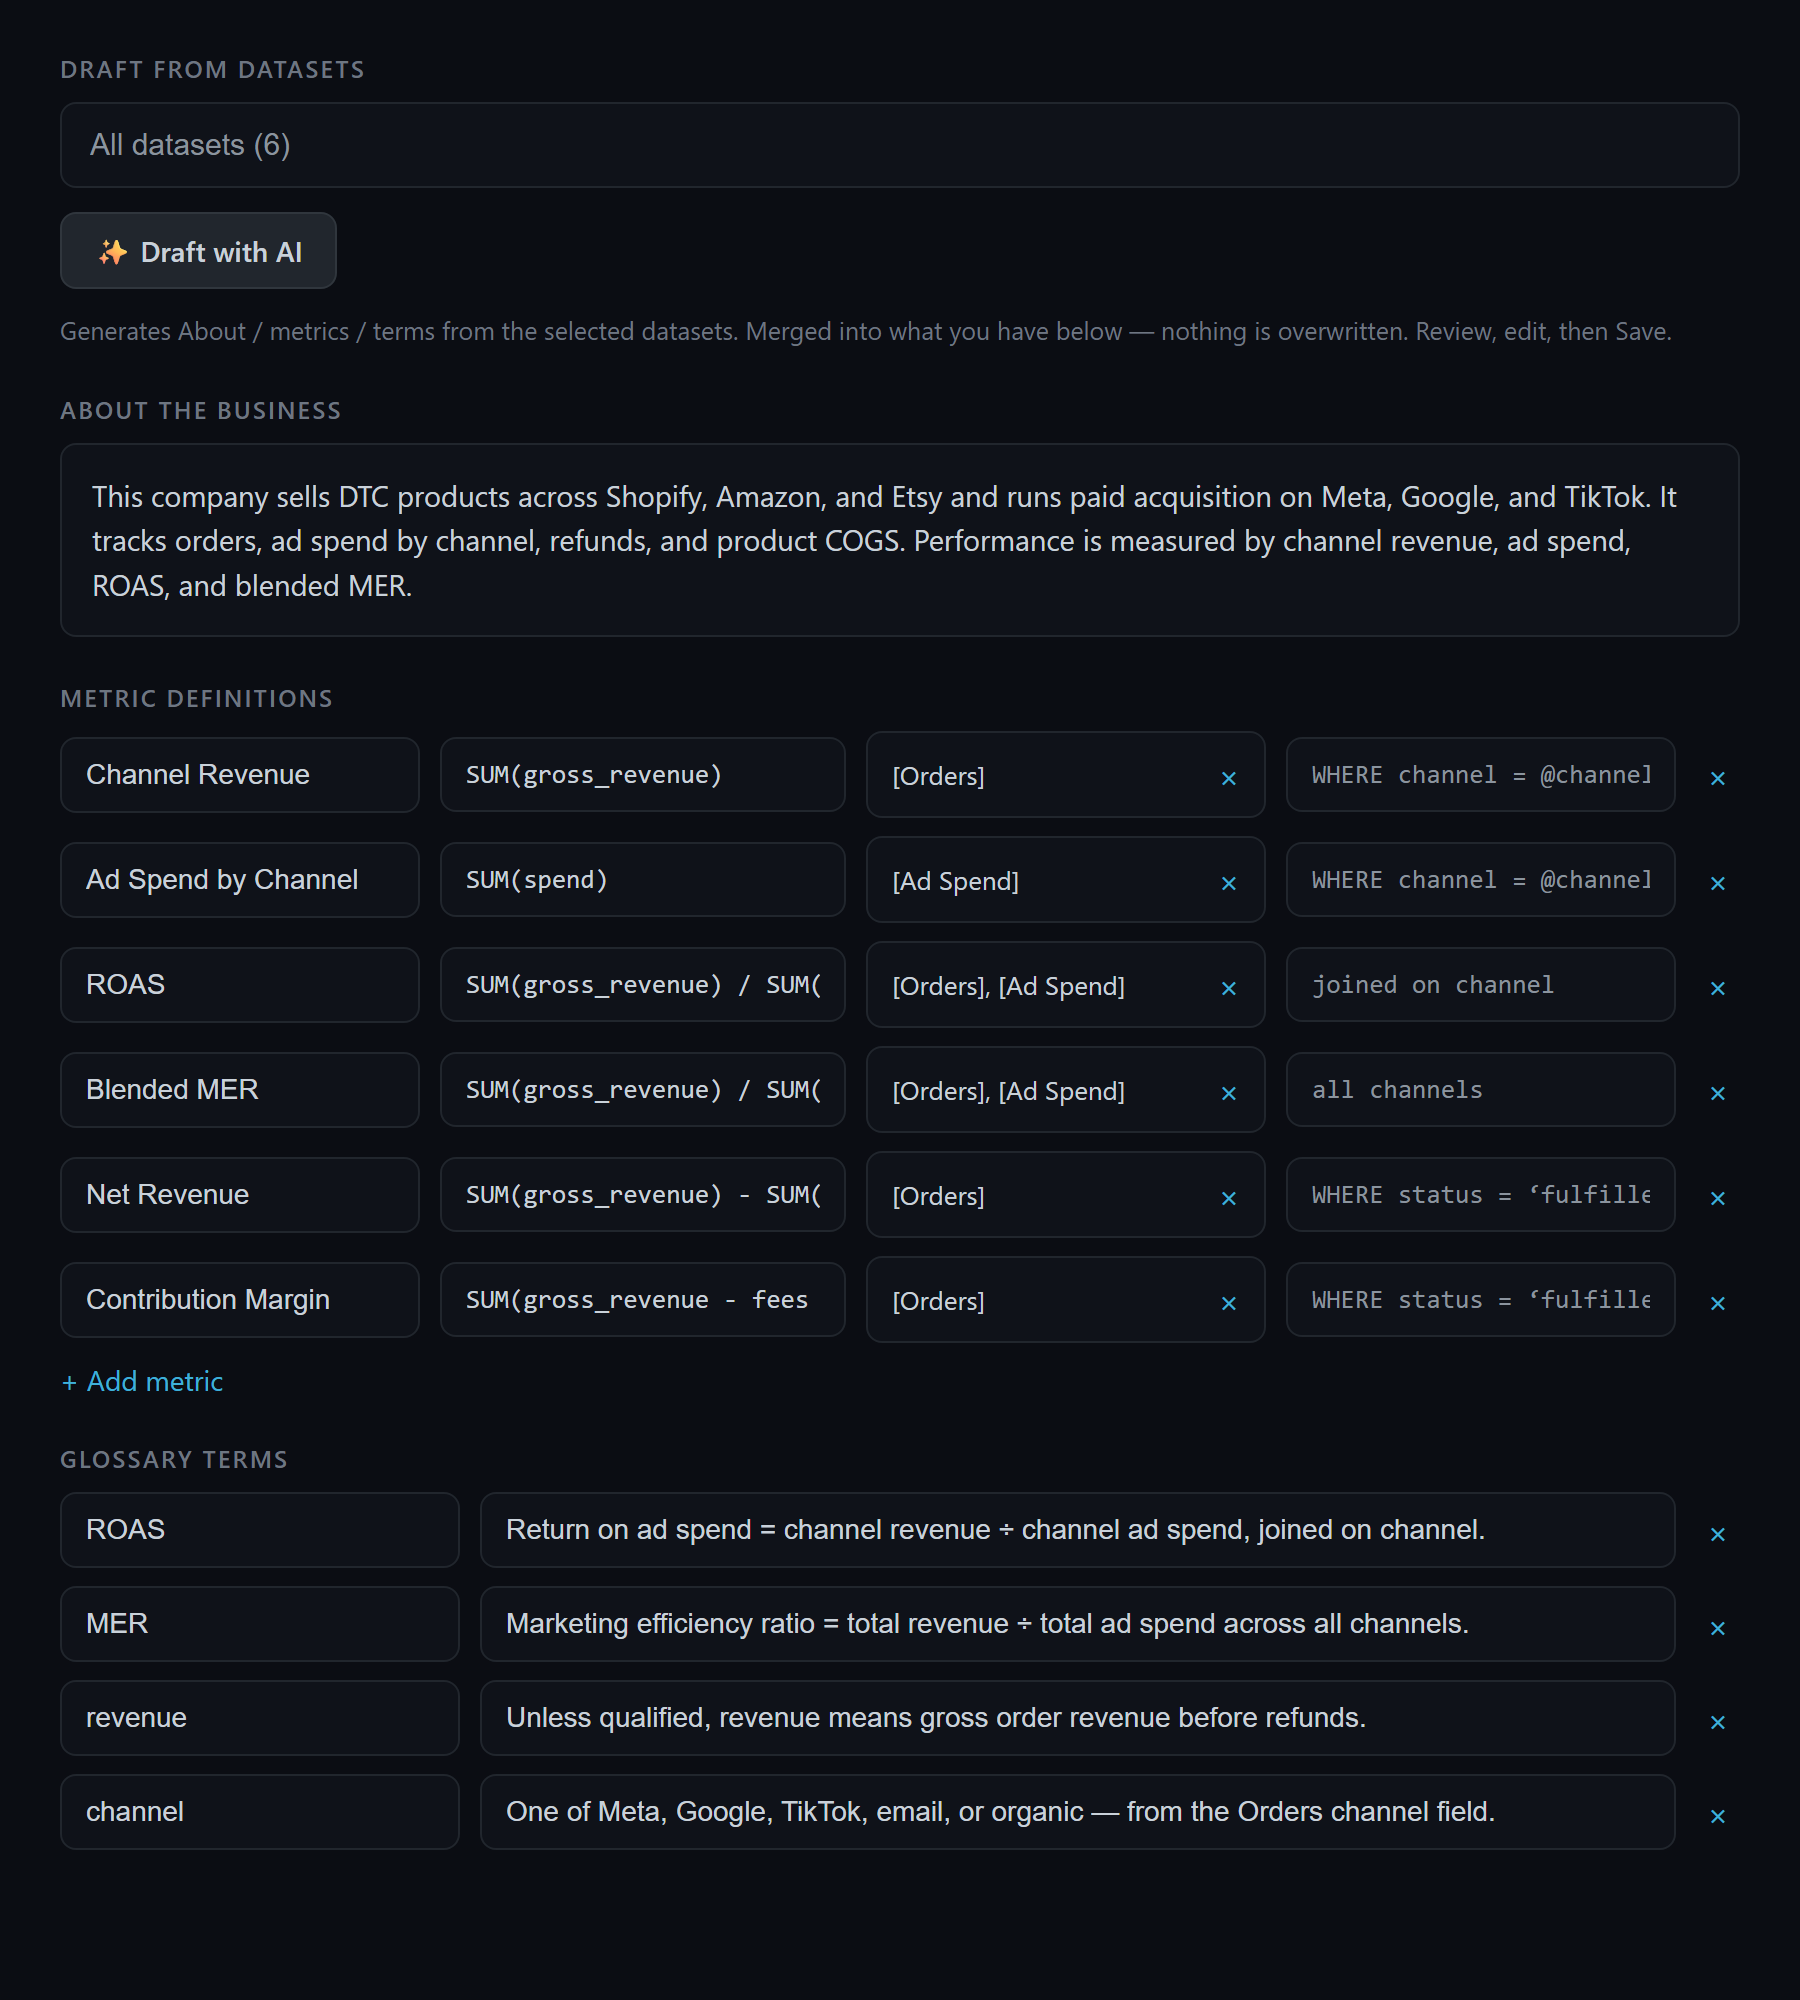
Ask for ROAS by channel in plain English
Upload your orders and ad-spend exports, then ask Quiriz for ROAS and MER by channel — defined once, consistent every time. Free to start.
Try Quiriz free →Frequently asked questions
How do I calculate ROAS by channel?
What is the difference between ROAS and MER?
What is a good ROAS?
Why is my channel ROAS higher than my real profit?
ROAS tells you what the spend returned; it does not tell you what a customer cost to acquire, which is the number that decides whether the spend was worth making at all. The formula and the decisions underneath it are in customer acquisition cost.